 |
|
|
|
Coffee Statistics: Exportation
See Coffee Production Statistics
for coffee produced in each coffee producing country.
Table 1. Harvesting
and Exporting: Coffee Producing Countries in 1999.
|
Coffee Producing Country
|
Coffee Harvesting Time
|
60
Kg Bags harvested
|
60
Kg bags exported
|
|
Brazil
|
March-October
|
27,170,000
|
23,135,000
|
|
Colombia
|
October-February
and April-June
|
9,300,000
|
9,995,000
|
|
Costa Rica
|
Atlantic coast:
August-November.
Pacific coast: September-December
|
2,467,000
|
2,196,000
|
|
Dominican
Republic
|
August-June
|
1,058,000
|
161,000
|
|
Ecuador
|
June-October
|
1,533,000
|
988,000
|
|
Ethiopia
|
August-January
|
3,833,000
|
1,818,000
|
|
Guatemala
|
October-January
|
4,500,000
|
4,669,000
|
|
Haiti
|
October-November
and February-March
|
385,000
|
161,000
|
|
Honduras
|
October-March
|
3,067,000
|
1,987,000
|
|
Indonesia
|
|
7,833,000
|
5,084,000
|
|
Jamaica
|
August-September
|
40,000
|
24,000
|
|
Kenya
|
October-December
(main) and June-August
|
1,433,000
|
1,113,000
|
|
Malawi
|
December-February
|
61,000
|
54,000
|
|
Mexico
|
High Altitudes:
November-January.
Low altitudes: August-November
|
6,193,000
|
4,358,000
|
|
Nicaragua
|
South: November-January
and August-September. North: December-March
|
1,304,000
|
983,000
|
|
Papua New
Guinea
|
April-September
|
1,286,000
|
132,000
|
|
Tanzania
|
October-December
|
773,000
|
634,000
|
|
Uganda
|
September-December
|
4,000,000
|
3,841,000
|
|
Venezuela
|
September-March
|
1,073,000
|
452,000
|
|
Zambia
|
October-March
|
45,000
|
54,000
|
|
Zimbabwe
|
July-October
|
189,000
|
141,000
|
Source: Hombres de Cafe and
SCAA.
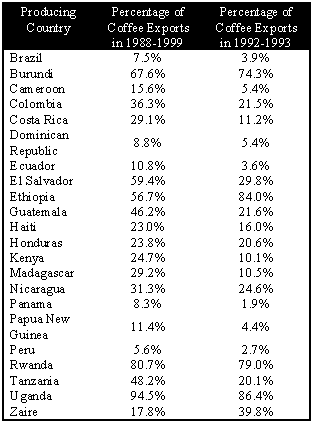
Table 2. Coffee exports as a percentage
of total exports.

Source: ICO Statistics May 1994. International Statistics
October 1994. From Hombres
de Cafe p. 18.
Related
Articles
Coffee Production Statistics
Coffee Importation Statistics
Historical Indicator Prices for Coffee
|
|
|
|
|
|
|
 |
|
 |
|
|
 |
|
|


